
Know what moves your finish date.
A critical-path Gantt with real finish-to-start dependencies, the critical path in red, float per task, baseline vs. actual, and subs assigned to the work — built right into the platform.
First month free · Unlimited users · No QuickBooks required.
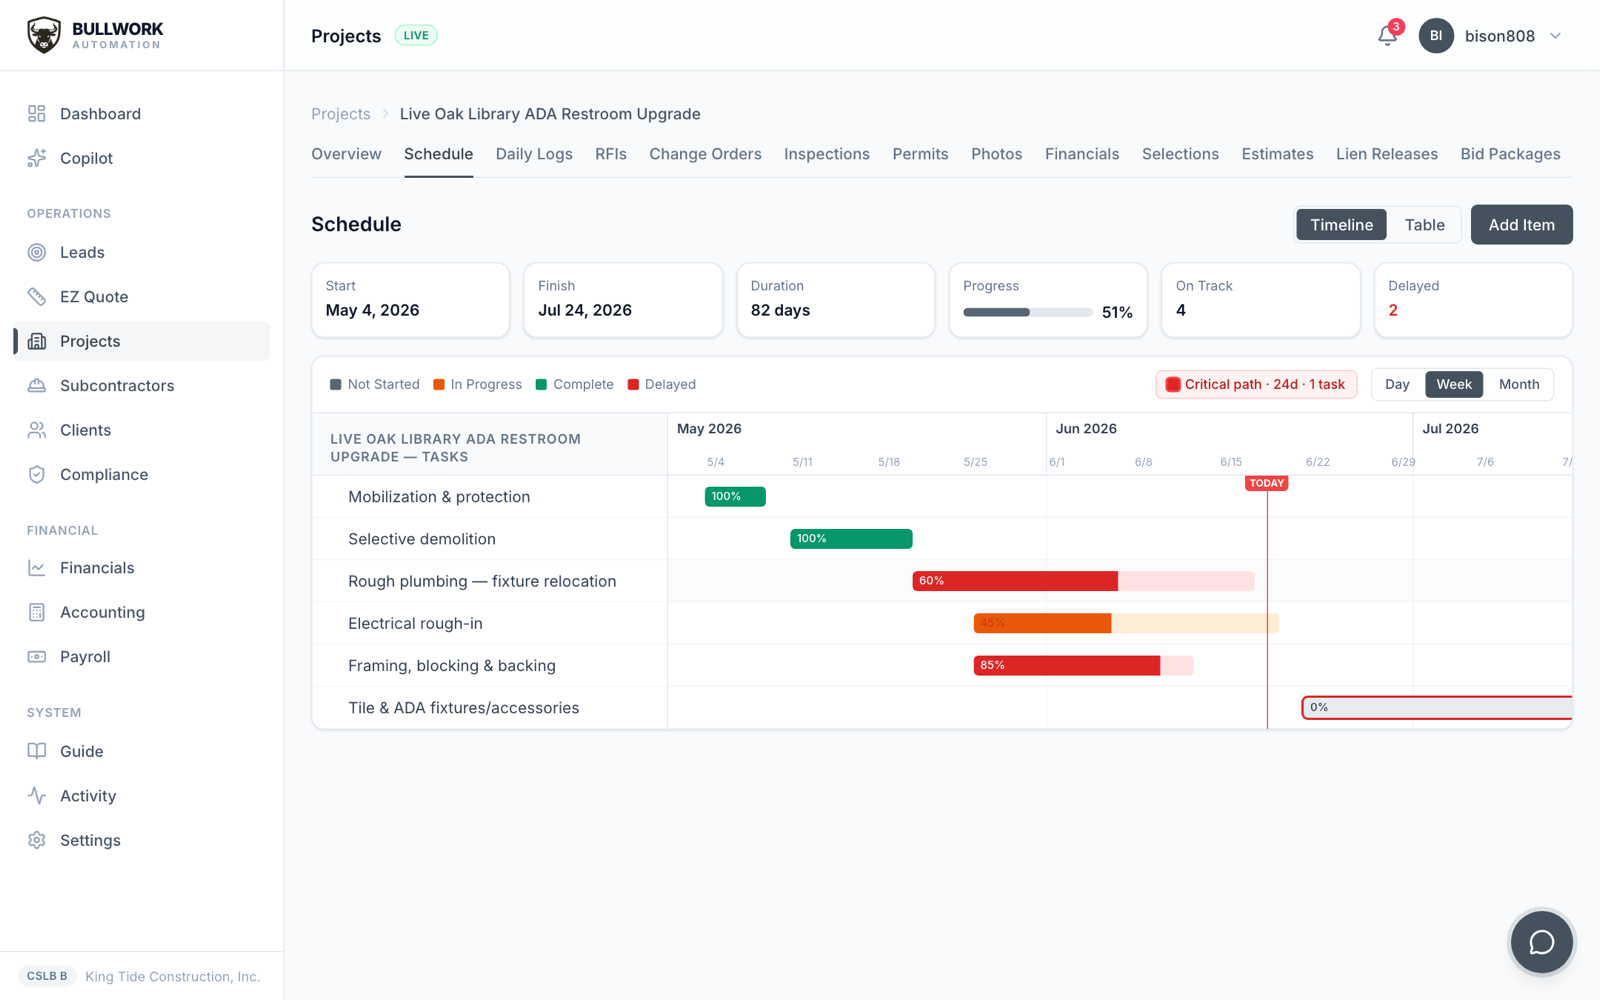
A real critical-path schedule, with the critical path and float called out.
Critical path scheduling
A schedule that does the math for you
The dependency graph and critical path are computed in-app — you manage the work, not the spreadsheet.
Critical path scheduling
See the path that decides your finish date
The platform builds the dependency graph in-app and computes the critical path for you. The zero-slack tasks — the ones that move your completion date if they slip — are highlighted in red, so you know exactly where to push.
- ✓Critical path computed automatically, no manual math
- ✓Zero-slack tasks highlighted in red
- ✓Know which delays actually cost you the end date
Construction Gantt chart
A Gantt that understands dependencies
Link tasks finish-to-start and the schedule reflows when one moves. This isn’t a static bar chart — it’s a real dependency model, so a slipped foundation pour pushes everything downstream the moment you log it.
- ✓Finish-to-start task dependencies
- ✓Move one task and the downstream chain reflows
- ✓Built in-app — no Primavera or MS Project license
Float
Know how much room each task has
Every task shows its float — the slack you have before it starts dragging the finish date. Tasks with float give you room to shuffle crews; tasks with none get your attention first.
- ✓Float shown per task
- ✓Spot where you have slack to reassign crews
- ✓Tasks with zero float are your daily priority
Baseline vs. actual
Track the plan against reality
Set a baseline at the start and watch actual progress against it. Each task carries its % complete, so the schedule shows where you are ahead, where you’re behind, and by how much — in one glance.
- ✓Baseline locked at kickoff vs. live actuals
- ✓% complete tracked per task
- ✓See slippage building before it’s a crisis
Resourcing
Tie tasks to the subs doing them
Assign each task to the subcontractor responsible. Now the schedule isn’t just dates — it’s who owns what and when, and it lines up with the commitments and portals the rest of the platform already tracks.
- ✓Assigned subcontractor on every task
- ✓Schedule lines up with commitments and AP
- ✓Subs see their dates in their no-login portal
Go deeper
Explore the rest of the platform
Questions
Construction scheduling, answered
What is the best construction scheduling software with critical path?+
Bullwork Automation builds a critical-path Gantt chart in-app: finish-to-start dependencies, the critical path computed and highlighted in red, float per task, baseline vs. actual, and % complete — with each task tied to the subcontractor doing the work.
How does critical path scheduling work in Bullwork?+
The platform builds the task dependency graph in-app and calculates the critical path — the chain of zero-slack tasks that determines your finish date. Those tasks are highlighted in red, and every task shows its float so you know where you have room.
Can I see a construction Gantt chart with task dependencies?+
Yes. Link tasks finish-to-start and the Gantt reflows automatically when a task moves, so a slipped task pushes everything downstream the moment you log it — no manual rescheduling.
Does it track baseline vs. actual schedule progress?+
Yes. Lock a baseline at kickoff and track actual progress against it, with % complete on every task, so you can see exactly where you’re ahead or behind and by how much.
If you can send an email, you can run a job on it.
See it run your numbers — bid to books — on your own jobs. Your first month is free.
Request a demo